Elasticsearch Monitoring
Stop getting caught off-guard by unforeseen issues with your Elasticsearch cluster.
Easy Installation
Hit the ground running with our easy Docker install process. Our agent can be installed within your environment and send metrics out to us, or the entire monitoring stack can be installed withn your environment.
- Easy, Dockerized install
- Pre-built dashboards and alerts
- Works for Elastic Cloud, AWS Opensearch, or on-prem
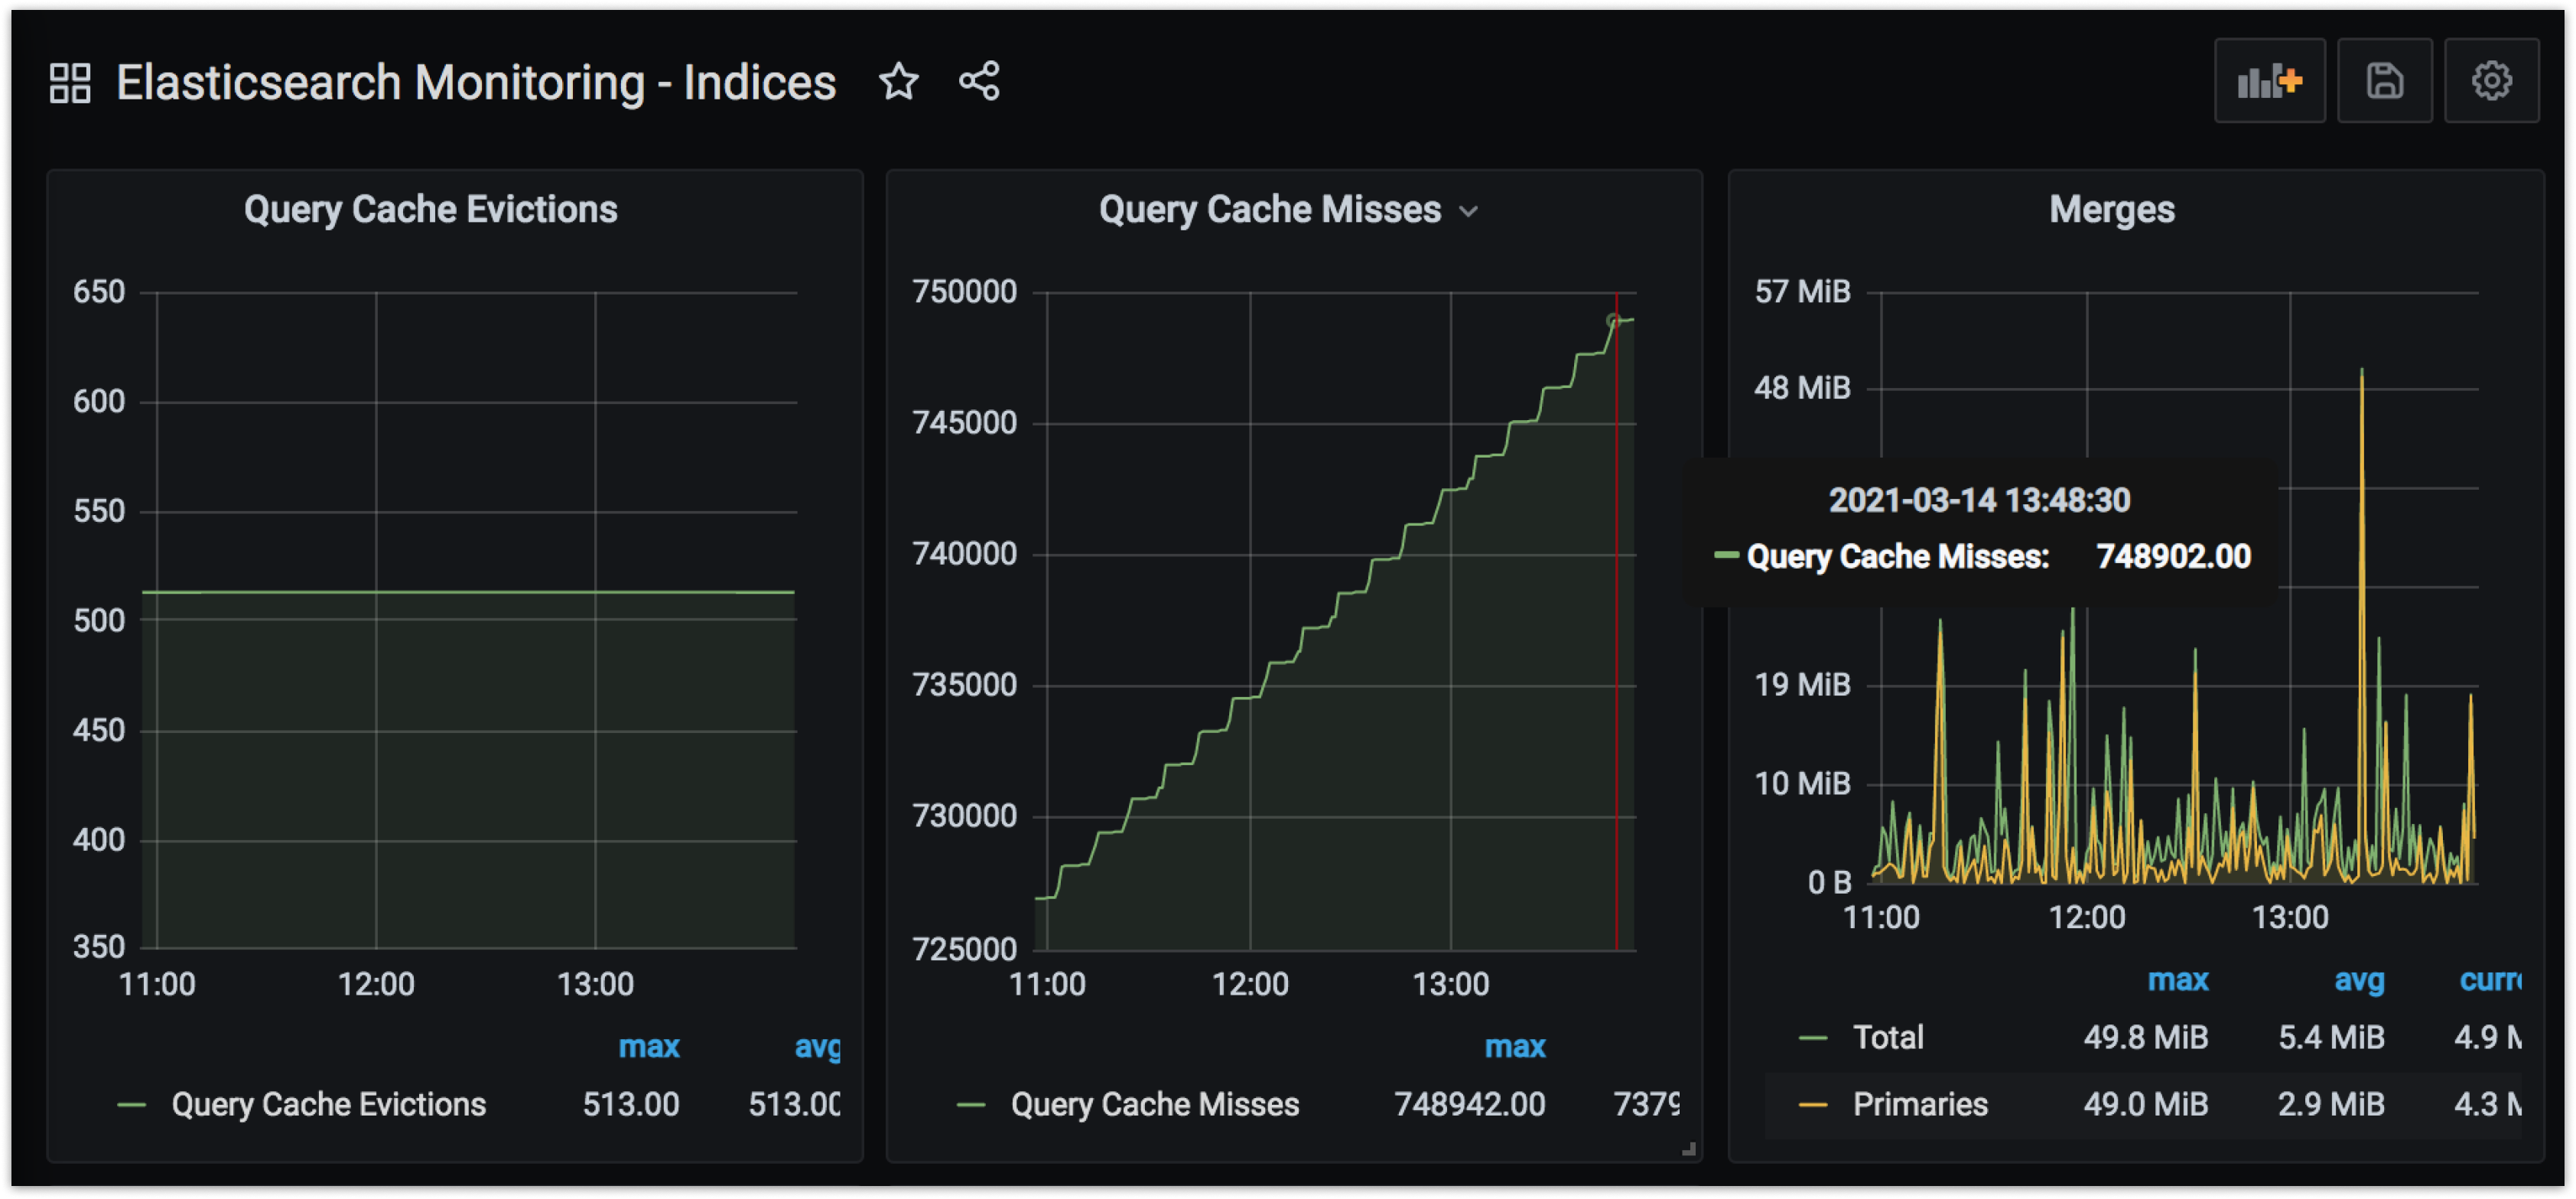
Index Metrics
Dive deep into per index Elasticsearch metrics. Go from high level metrics on shard distributions across indices, to per index metrics on cache utilization.
- Lucene Memory Usage
- Cache Metrics
- Shard Stats
- Segment Stats
- Fielddata Stats
- Merge Stats
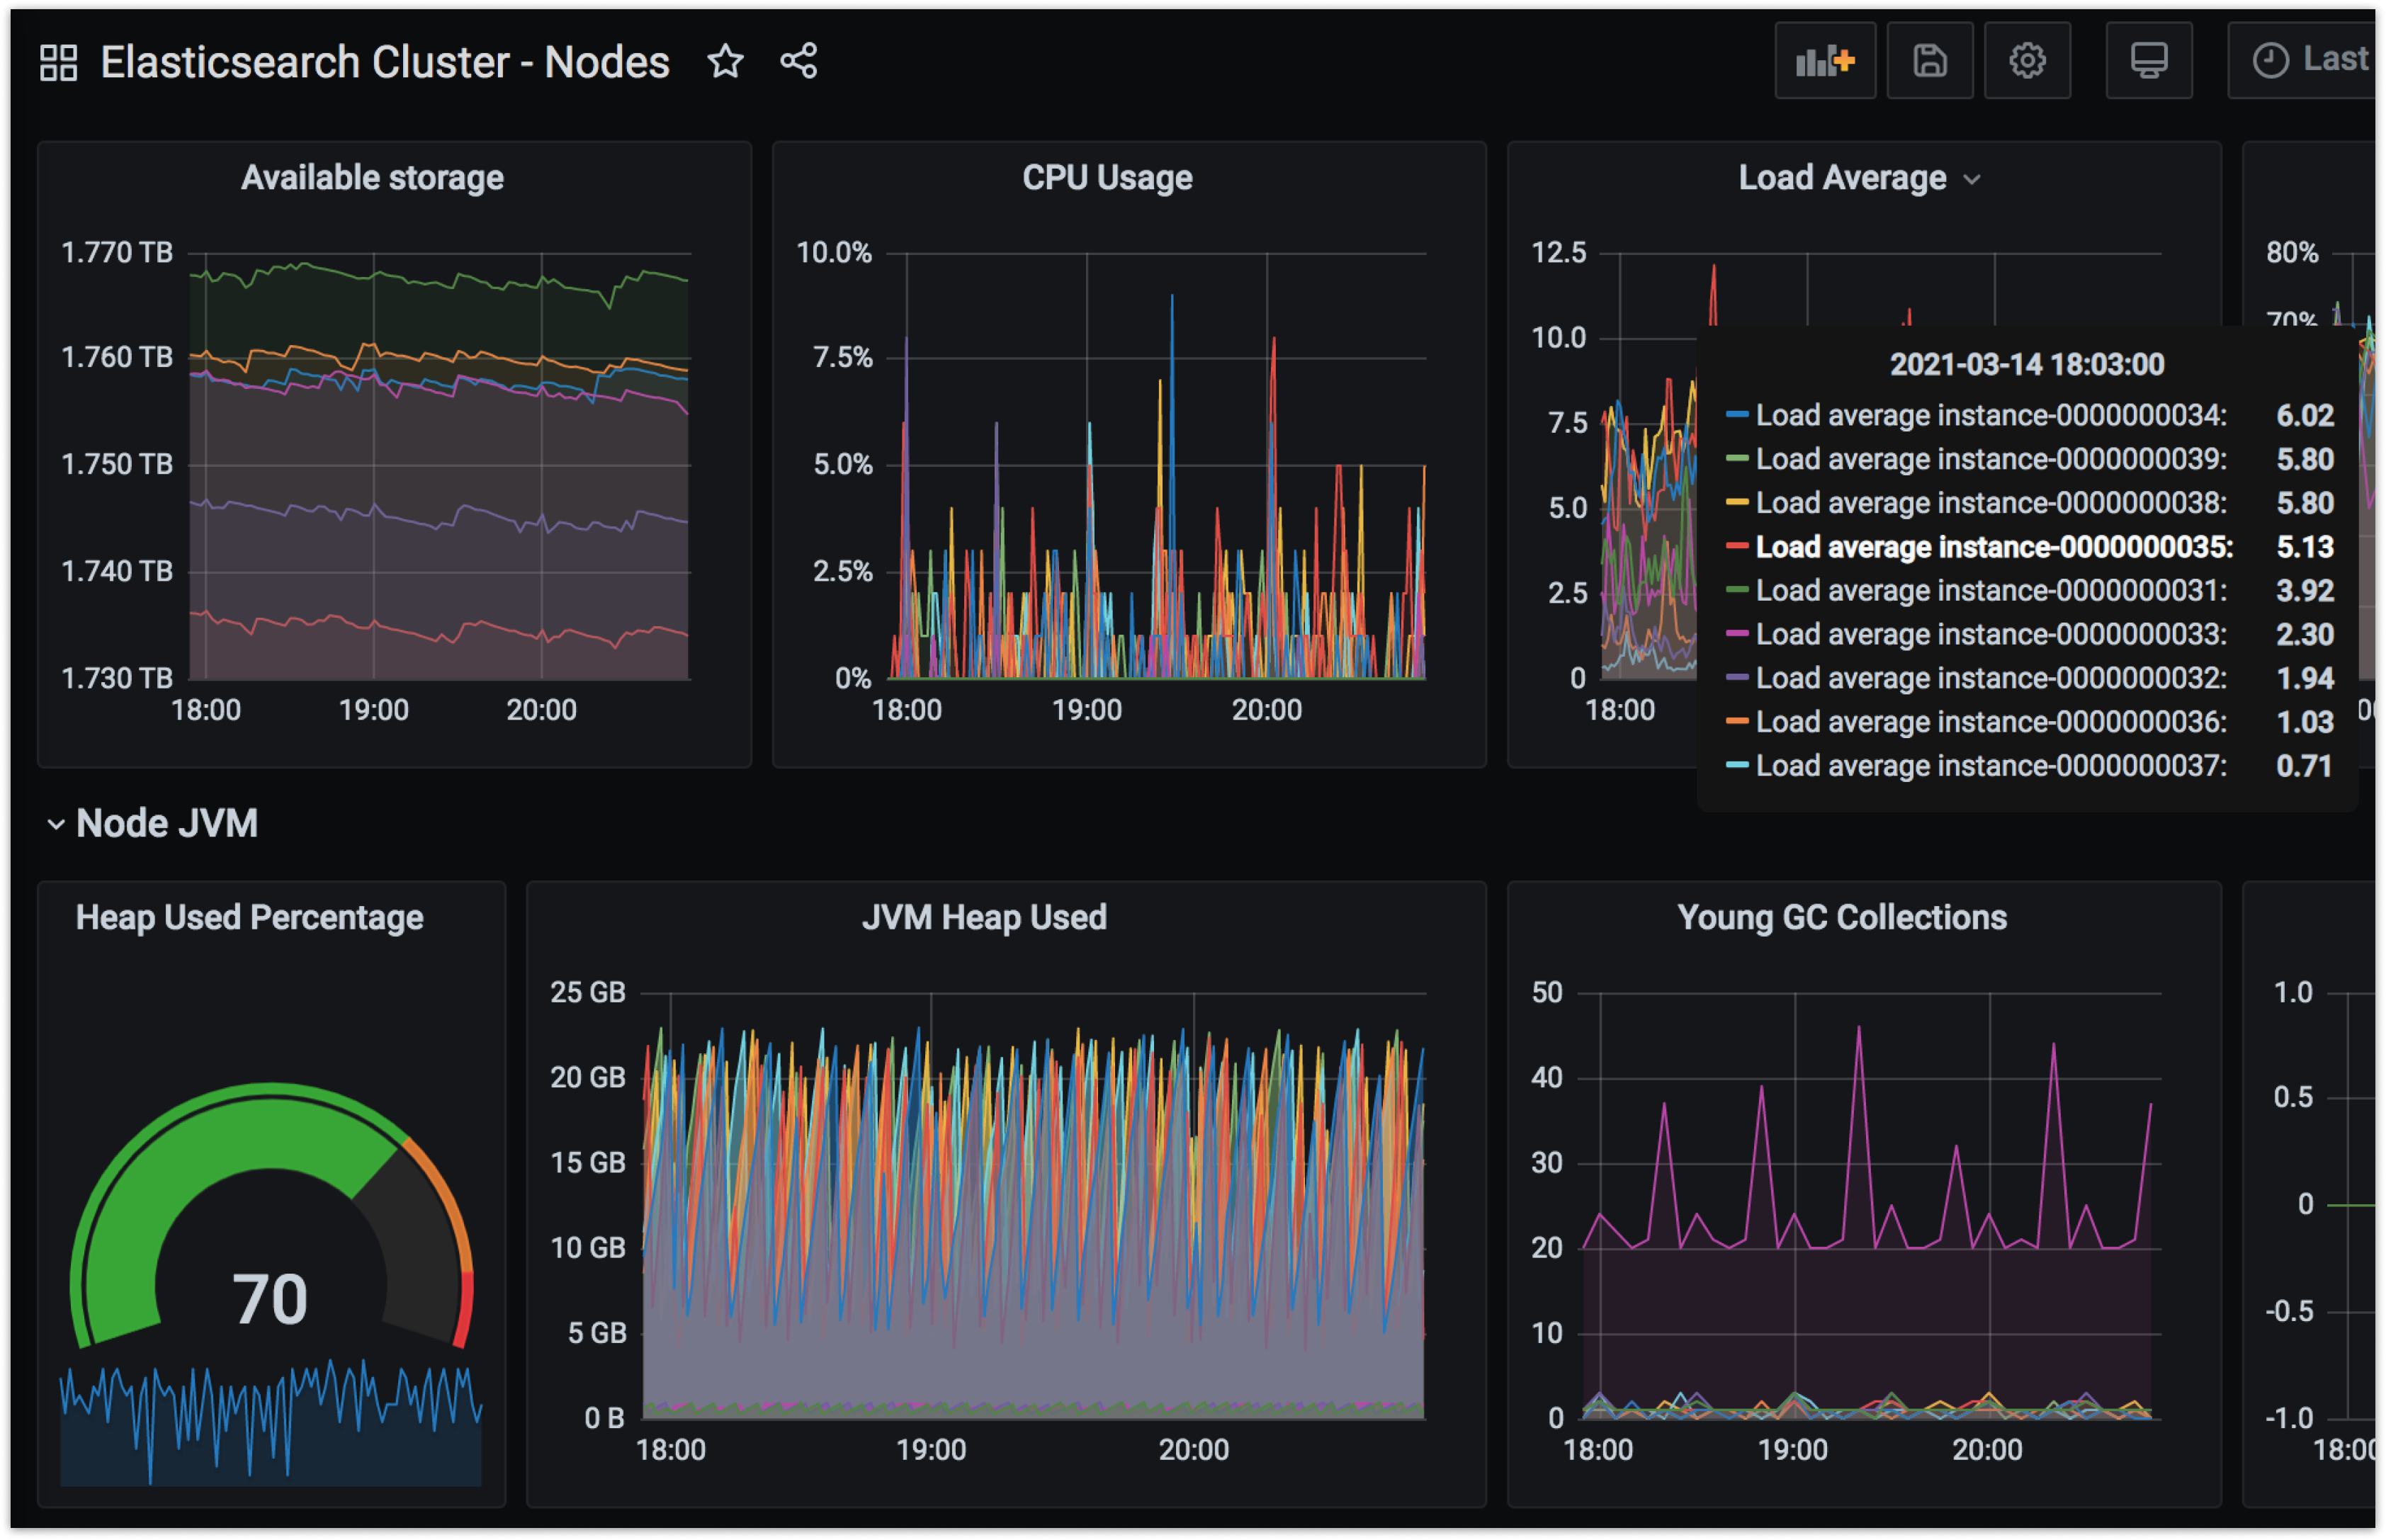
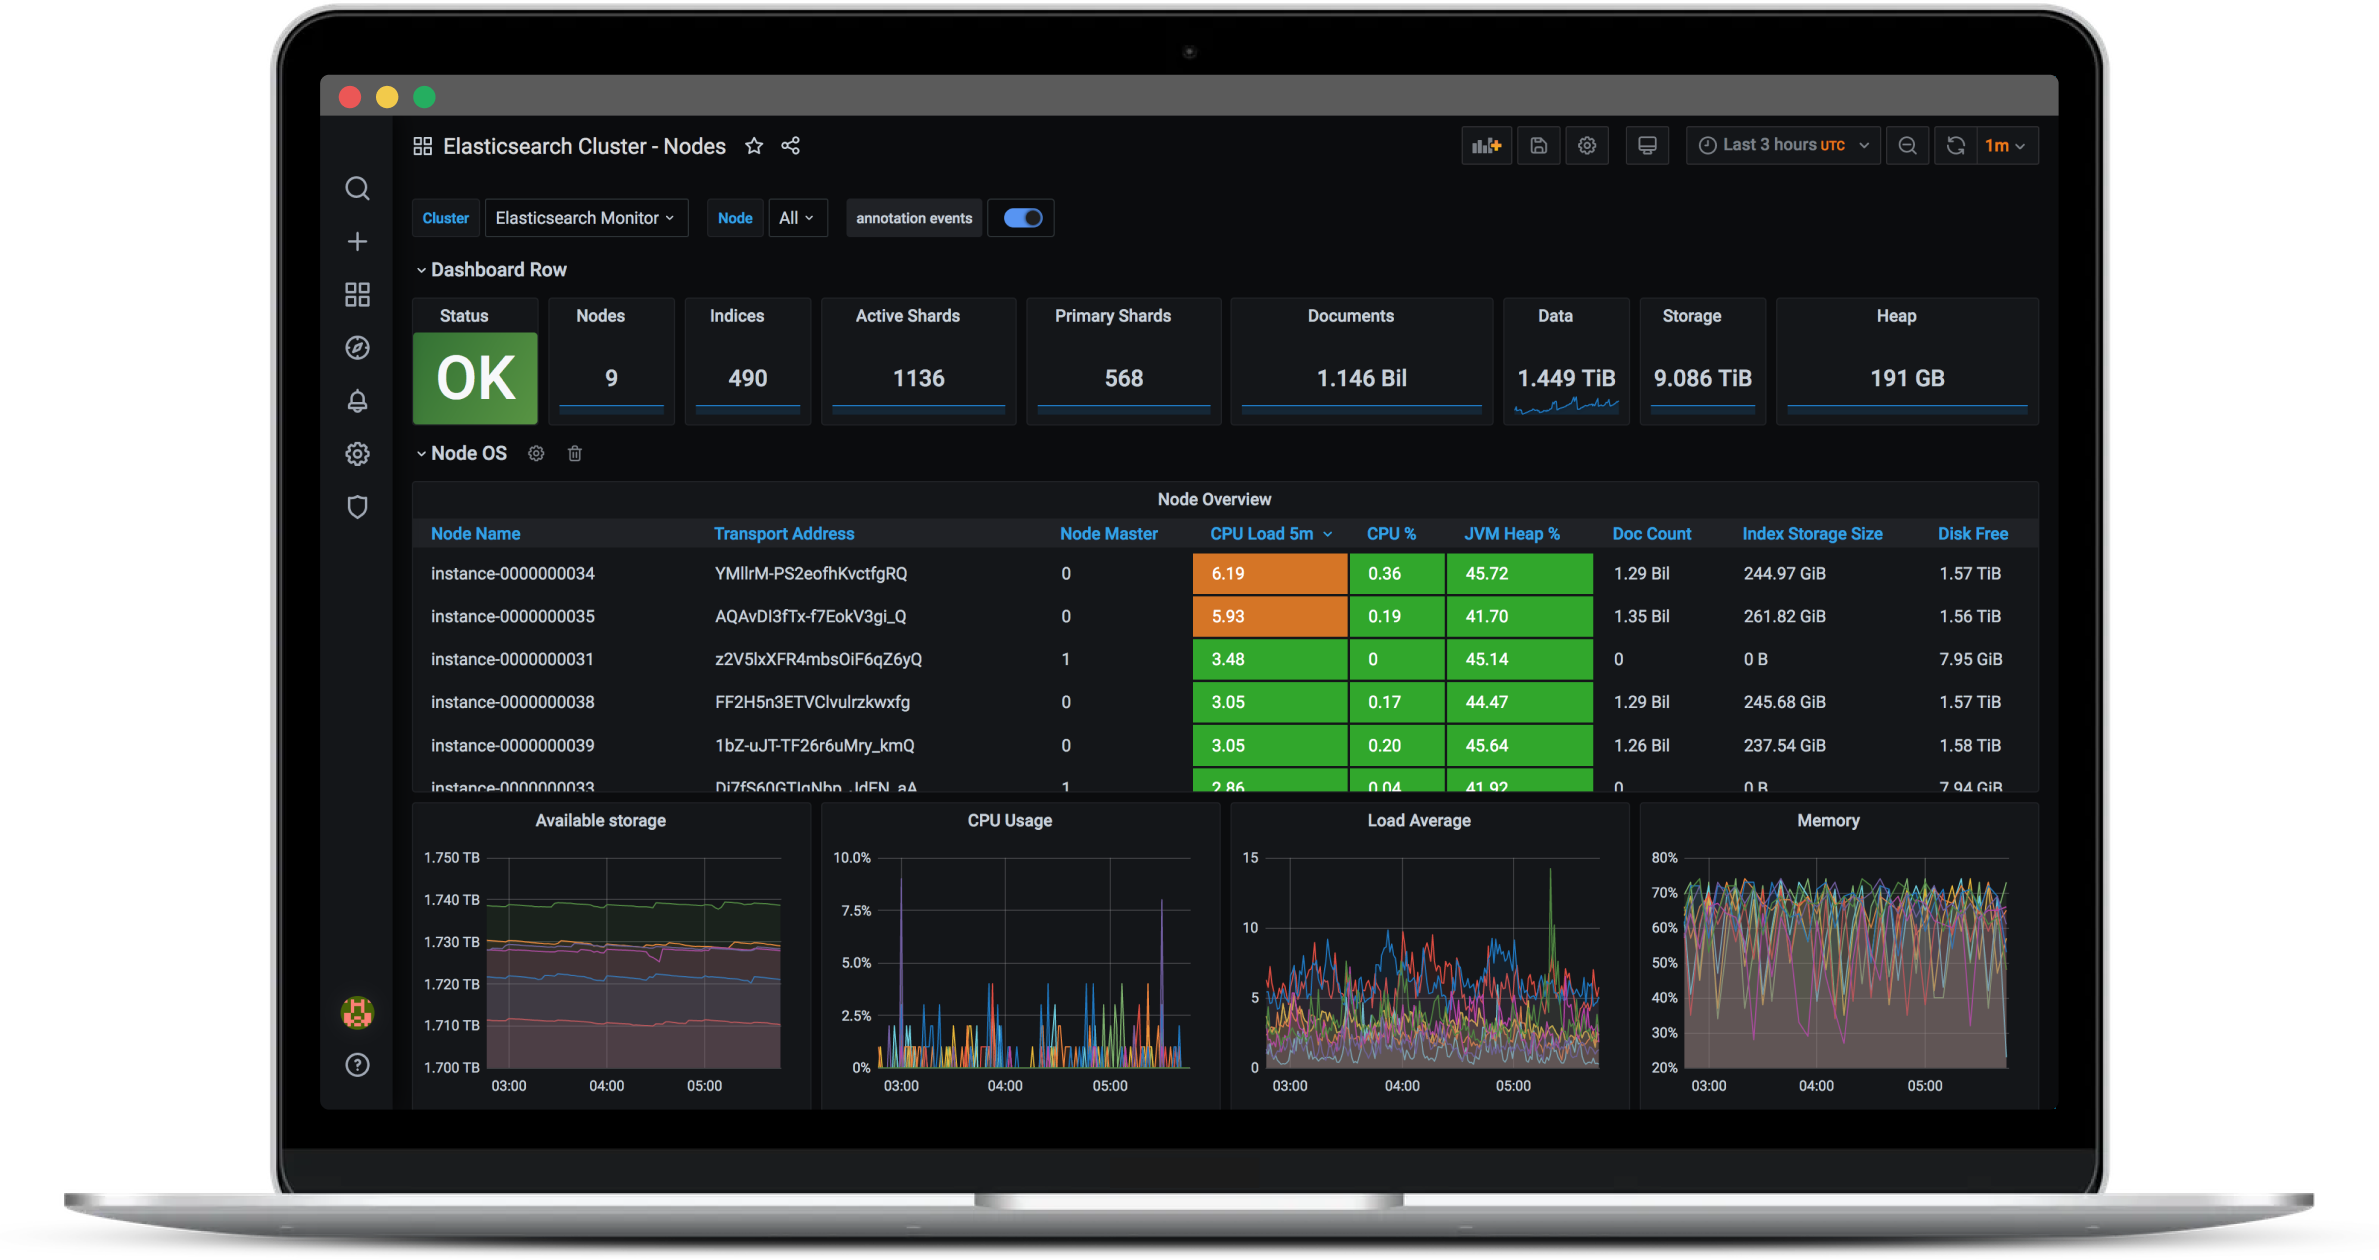
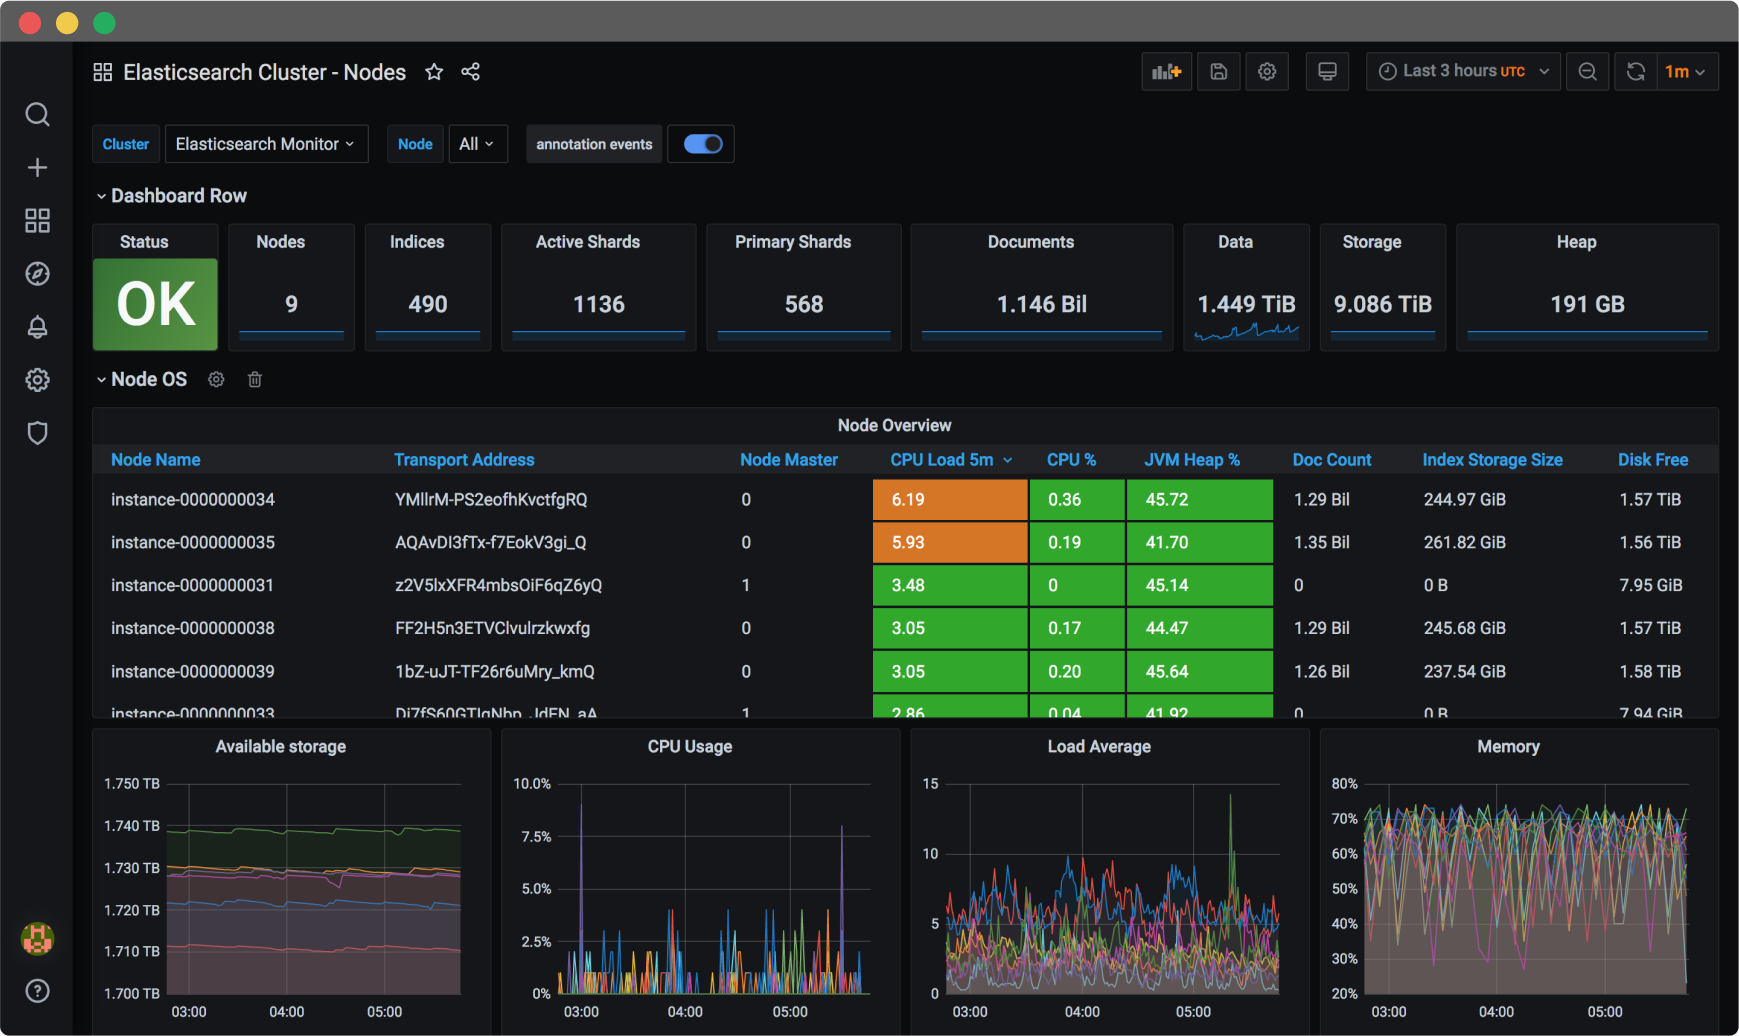
Node Metrics
Sometimes you need to be able to see metrics at the per node level. We display those metrics, even if you're on AWS Opensearch. If one of the nodes on AWS Opensearch is bottlenecked on CPU, you'll know.
- JVM Heap Utilization
- Load Averages
- Garbage Collection Stats
- Threadpool Stats
- Disk I/O Stats
- Cache Utilization
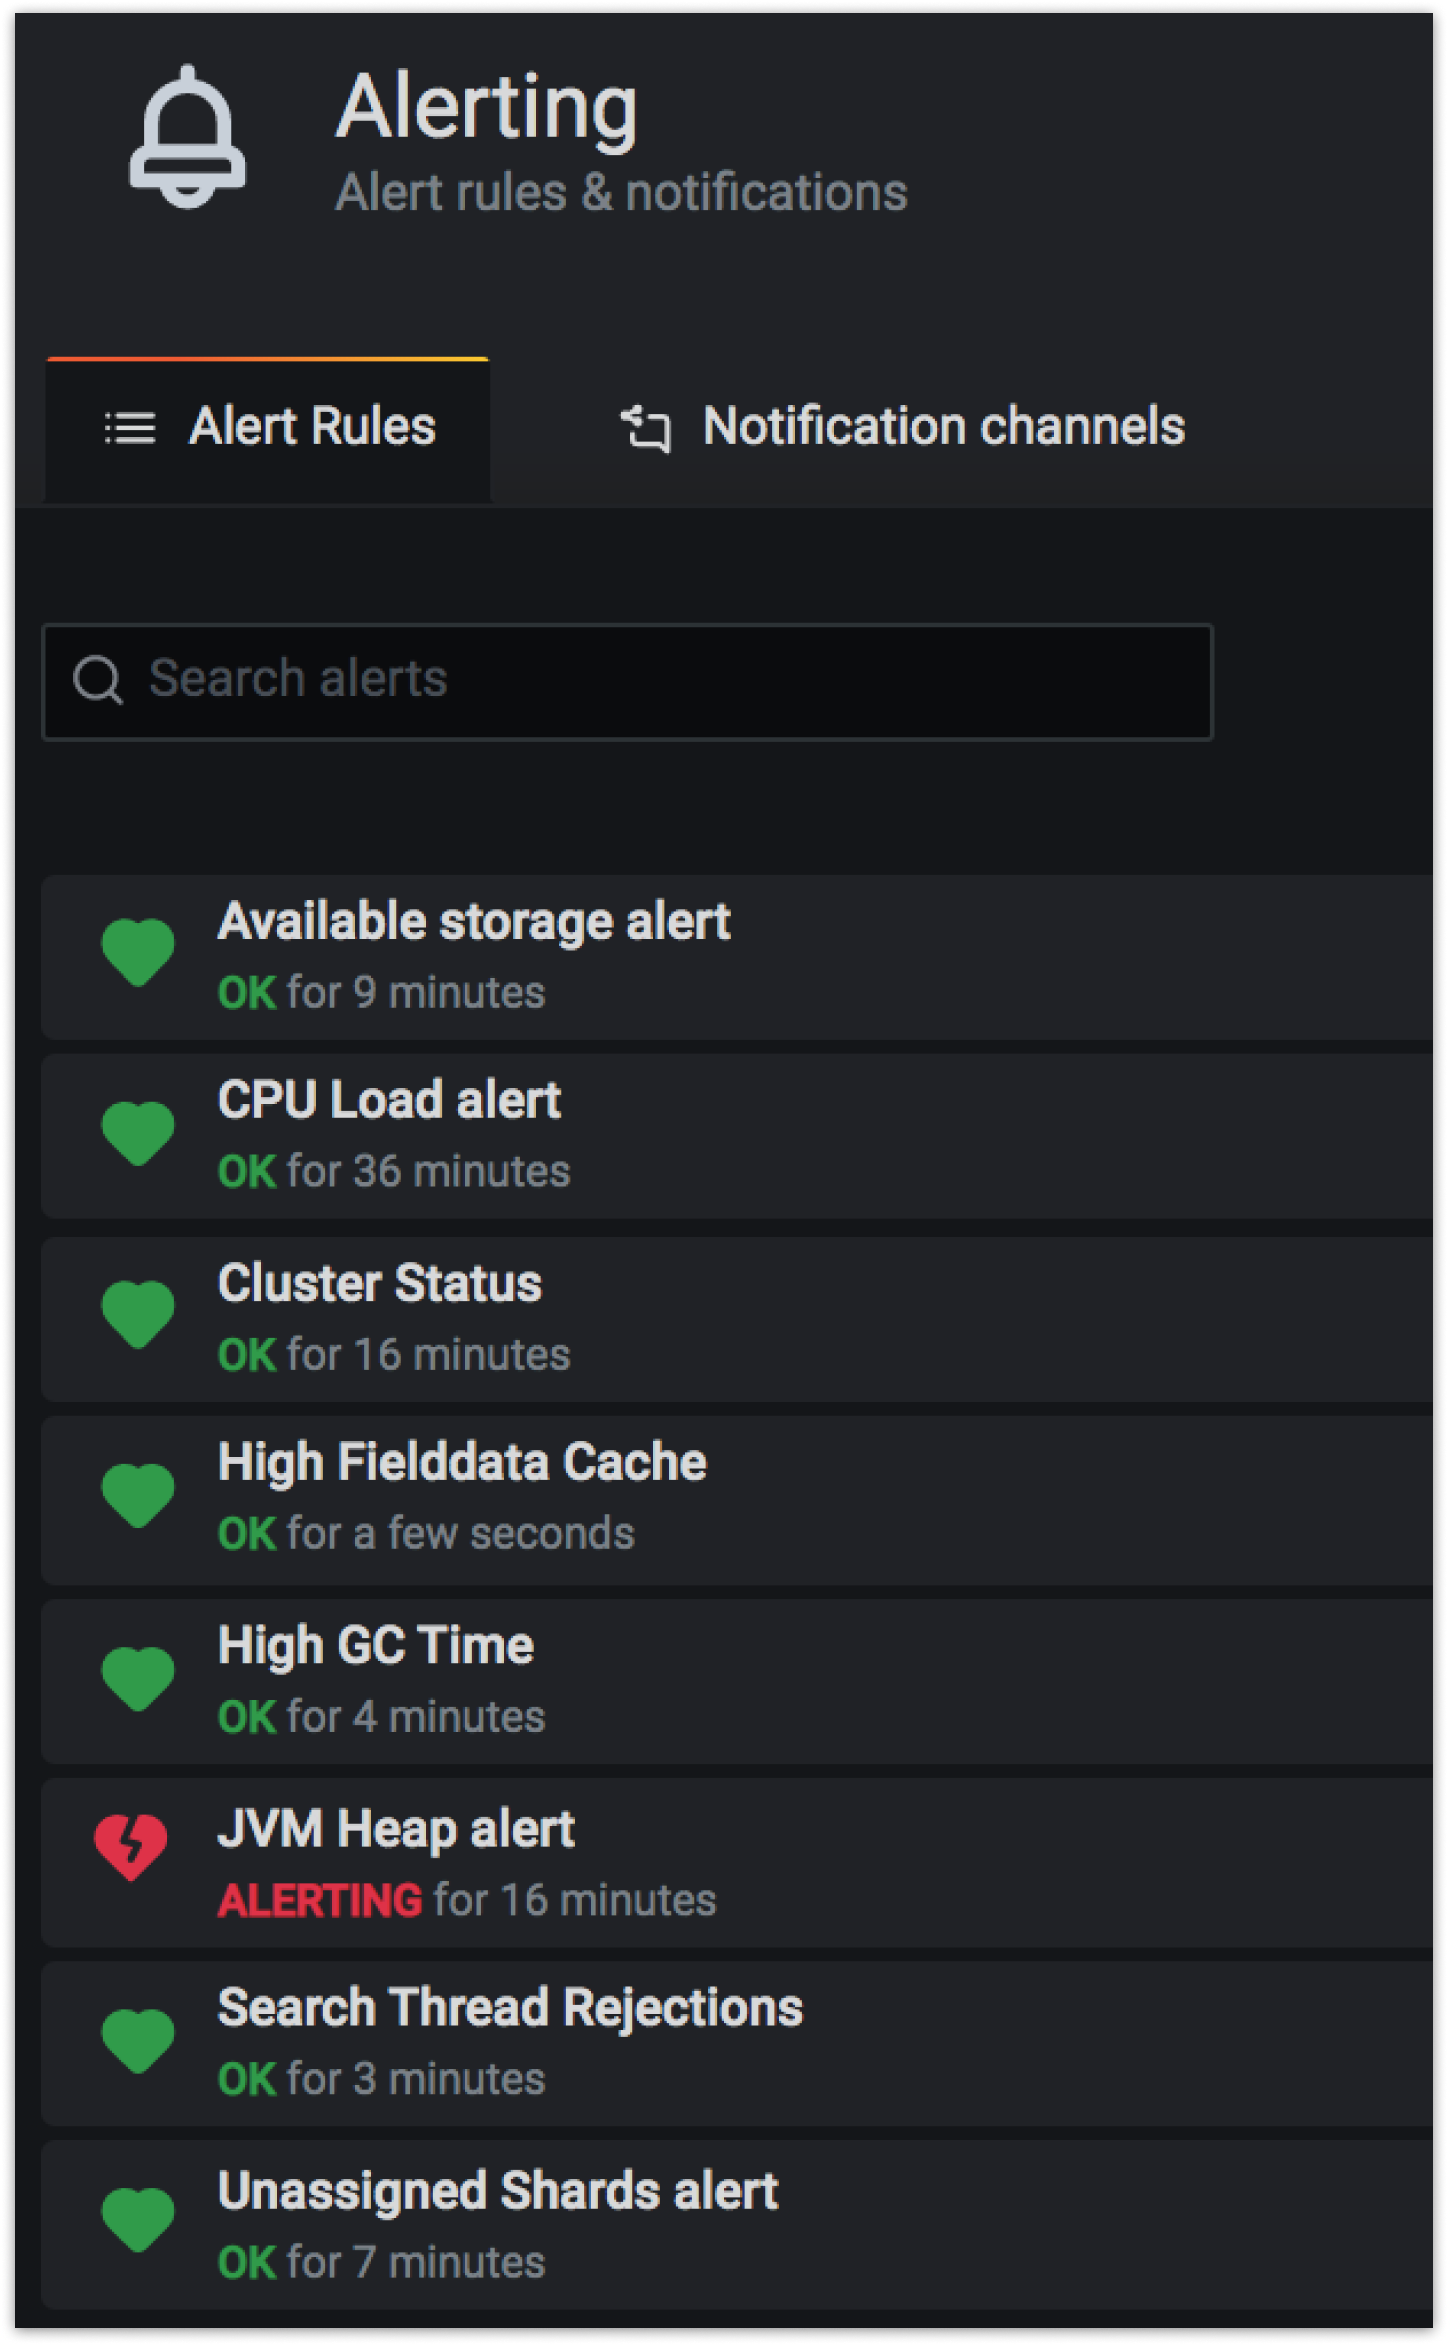
Prebuilt Alerts
We know all ways that Elasticsearch can break and you can benefit from that experience out of the box.
- Available Storage
- Cluster Status
- Heap Usage
- Cache Evictions
- High GC Times
- Threadpool Rejections
Elasticsearch Monitoring
That Works
Don't have your team reinvent the wheel. Use our out-of-the-box monitoring solution battle-tested against the largest Elasticsearch deployments.
Start today with a free 1-hour consultation.